We have selected some scrips which may give some potential movement on Wednesday.
(14-03-2018) .
These stocks are capable of showing 3% volatility either above the current price or below.
I will update the scrips with their potential reversal and continuation points. I am not giving any trade tips for now you shall just keep these stocks in your watch list and observe the movement for the day. I will trade only on the below stocks, except if any stocks shows good performance with volume. In either case I will upload my trade video daily in the evening and we will analyze why I performed that trade.
Tuesday's Profit
Checkout my video on how to place entry and exit point for the below stocks.
and How I selected these stocks .
CHART AGENDA
RED LINES ARE RESISTANCE LINES
GREEN LINES ARE SUPPORT LINES
HOW TO TRACK THE STOCKS
I always use 30 mins candle though I do intraday trading, I will explain the candle settings later.
Observe the scrips volatility, at the reference points
Is the sellers increasing or the buyers increasing ?
If you find the strength of sellers or buyers at the reference points using volume, did they succeed in moving the price to their desired value.
Try to find answer for the above questions for detailed analysis later when I post the knowledge content.
AUROPHARMA
DHFL
JETAIRWAYS
TATASTEEL
Observe the movement of above stocks as said, and please have a note.
You can also check my you tube channel for more updates on logical Intraday trading in Indian Stock Market here. We will post the updates on how I will book profit with the above stocks today in the evening Subscribe to our youtube channel for more updates
We have selected some scrips which may give some potential movement on Tuesday
(13-03-2018) .
These stocks are capable of showing 3% volatility either above the current price or below.
I will update the scrips with their potential reversal and continuation points. I am not giving any trade tips for now you shall just keep these stocks in your watch list and observe the movement for the day. I will trade only on the below stocks, except if any stocks shows good performance with volume. In either case I will upload my trade video daily in the evening and we will analyze why I performed that trade.
Checkout my video on how to place entry and exit point for the below stocks.
and How I selected these stocks .
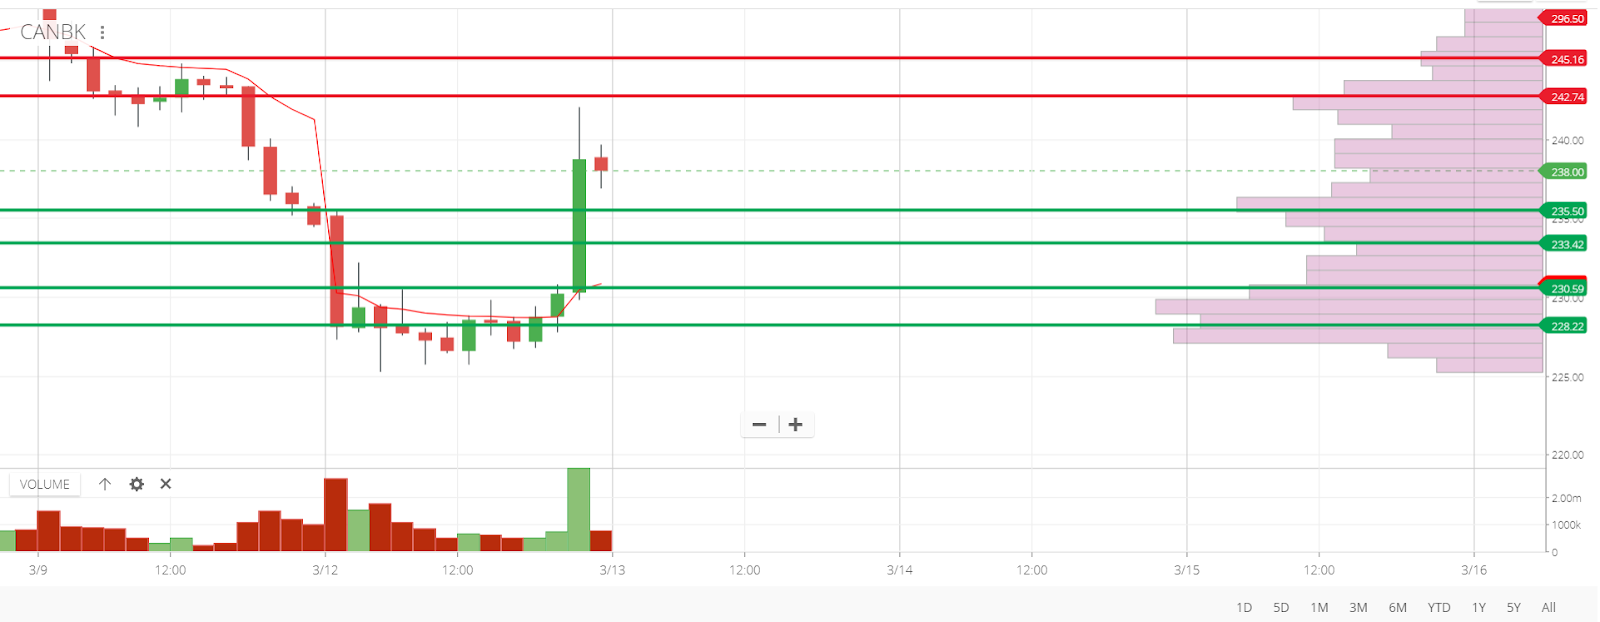
CHART AGENDA
RED LINES ARE RESISTANCE LINES
GREEN LINES ARE SUPPORT LINES
HOW TO TRACK THE STOCKS
I always use 30 mins candle though I do intraday trading, I will explain the candle settings later.
Observe the scrips volatility, at the reference points
Is the sellers increasing or the buyers increasing ?
If you find the strength of sellers or buyers at the reference points using volume, did they succeed in moving the price to their desired value.
Try to find answer for the above questions for detailed analysis later when I post the knowledge content.
CANBK
HINDALCO
HINDZINC
Observe the movement of above stocks as said, and please have a note.
You can also check my you tube channel for more updates on logical Intraday trading in Indian Stock Market here. We will post the updates on how I will book profit with the above stocks today in the evening Subscribe to our youtube channel for more updates
We have selected some scrips which may give some potential movement on Monday
(12-03-2018) .
These stocks are capable of showing 3% volatility either above the current price or below.
I will update the scrips with their potential reversal and continuation points. I am not giving any trade tips for now you shall just keep these stocks in your watch list and observe the movement for the day. I will trade only on the below stocks, except if any stocks shows good performance with volume. In either case I will upload my trade video daily in the evening and we will analyze why I performed that trade.
Checkout my video on how to place entry and exit point for the below stocks.
and How I selected these stocks .
CHART AGENDA
RED LINES ARE RESISTANCE LINES
GREEN LINES ARE SUPPORT LINES
ORANGE BOX IS THE VALUE AREA FOR THE STOCK
HOW TO TRACK THE STOCKS
I always use 30 mins candle though I do intraday trading, I will explain the candle settings later.
Observe the scrips volatility, at the reference points
Is the sellers increasing or the buyers increasing ?
If you find the strength of sellers or buyers at the reference points using volume, did they succeed in moving the price to their desired value.
Try to find answer for the above questions for detailed analysis later when I post the knowledge content.
VOLTAS
JINDALSTEEL
AJANTPHARM
CENTURYTEX
MUTHOOTFIN
ORIENTBANK
CIPLA
Observe the movement of above stocks as said, and please have a note.
You can also check my you tube channel for more updates on logical Intraday trading in Indian Stock Market here. We will post the updates on how I will book profit with the above stocks today in the evening Subscribe to our youtube channel for more updates
This is Hari from FIG posting end of the day analysis on the stock we selected yesterday (11-03) for today's(12-03) intra-day trading.
PROFIT
For those who are not aware on how we selected the stock please watch this video demonstrating How to Pick Stock for Intraday in 2mins. Subscribe to My channel to learn more strategies and technique
To identify the entry and exit points for each stock watch my video on How to pick Entry and Exit point for intraday.
These are the list of stocks and its support and
resistance which I posted yesterday, these stock gave an average of 4%
move today if we had fully capitalized the movement each stock would
have given atleast 60% Profit by using leverage . Click here to see the stocks
I have place trade on two stocks and gained a profit of 23% intra-day you shall analyze other stocks and comment if you have any doubts.
CENTURYTEX
We found the strength of buyers was very strong when the market breached two of our resistance line, so we went long, But the stop Loss was too low, sudden spike caused the trade to exit. Later I was not able to follow through as the capital was locked in orient Bank.
But then it was a nice trade.
ORIENTBANK
Orient bank behaved as expected it fell down from out resistance line and the second 30 mins candle refused to move up which shows our resistance line was strong sellers who gapped down the scrip, shorted and booked profit in 90mins A big profit though.
MUTHOOTFIN
As Marked the muthootfin came down to the support line we had drawn yesterday and it reversed from there. Just went long, knowing the strength of buyers from Market Depth. Booked Profit like a charm
This is how we have to
analyze the market for entry and exit. We should never place a trade in
hurry market will always give opportunity for you to enter trade so
time the right trade. It does not mean we have place a trade the moment
we see a odd change in the market, we have to wait and confirm that the
change is valid reversal point. Just follow our support and resistance line , and follow my strategies to book easy profit without indicators.
Other stocks which we picked also showed some movement.
Check the blog daily at 8.45AM for the stock pick for the day.
Subscribe to our youtube channel (FIG Learn Market the right way)
for more updates on understanding the market and follow the facebook page (FIG Financially Independent Group) and the blogger for instant updates.
We have selected some scrips which may give some potential movement on Friday
(09-03-2018) .
These stocks are capable of showing 3% volatility either above the current price or below.
I will update the scrips with their potential reversal and continuation points. I am not giving any trade tips for now you shall just keep these stocks in your watch list and observe the movement for the day. I will trade only on the below stocks, except if any stocks shows good performance with volume. In either case I will upload my trade video daily in the evening and we will analyze why I performed that trade.
CHART AGENDA
RED LINES ARE RESISTANCE LINES
GREEN LINES ARE SUPPORT LINES
HOW TO TRACK THE STOCKS
I always use 30 mins candle though I do intraday trading, I will explain the candle settings later.
Observe the scrips volatility, at the reference points
Is the sellers increasing or the buyers increasing ?
If you find the strength of sellers or buyers at the reference points using volume, did they succeed in moving the price to their desired value.
Try to find answer for the above questions for detailed analysis later when I post the knowledge content.
CENTURY TEX
CGPOWER
INDIGO
INFRATEL
KAJARIACER
Observe the movement of above stocks as said, and please have a note.
You can also check my you tube channel for more updates on logical Intraday trading in Indian Stock Market here.
We will post the updates on how I will book profit with the above stocks today in the evening Subscribe to our youtube channel for more updates
This is the end of the day analysis on the stock we selected yesterday (07-03) for today's(08-03) intra-day trading.
For those who are not aware on how we selected the stock please watch this video demonstrating How to Pick Stock for Intraday in 2mins. Subscribe to My channel to learn more strategies and technique
These are the list of stocks and its support and resistance which I posted yesterday, these stock gave an average of 4% move today if we had fully capitalized the movement each stock would have given atleast 60% Profit by using leverage . Click here to see the stocks
I have place trade on two stocks and gained a profit of 44% intra-day and my friend earned 28% I will analyze the four stocks which we traded, you shall analyze other stocks and comment if you have any doubts.
PROFIT
DHFL
DHFL as we expected yesterday, came near to out second resistance zone and started to retreat, on checking the total buy and sell volume, suddenly a huge volume was executed at market price. Market orders are normally placed by traders who have very good capital. We retail traders will always tend to place limit orders as we are low on capital. Once the sellers took control of the scrip it just fell down from the high. We could have easily gained 20 points from a 500Rs stock, pure logic. As the stock did not have any visible support line, we have to wait for the reversal point and exit if we tend to stay in the market for long time.
IDBI
We are continuously profiting from IDBI for the past three days, this is because I said on Monday that IDBI has got a strong rejection from a strong resistance zone. Due to the strength of the resistance at the price level 90 we observed on Monday, the stock is facing a downfall from then. We just made sure that we book profit at each downfall. Again today it got rejected from yesterdays resistance zone of 83.5.
JINDALSTEEL
JINDALSTEL showed a great movement today, reversing at exact resistance zone we have marked 237.62 . The stock had a nice down fall the moment it got rejected from a visible resistance zone we marked.
MINDTREE
MINDTREE again reversed exactly from the point we marked as a resistance line 843.52. I was too bearish on this stock the moment I found that the sellers were distributing at that resistance line, I bought a very few stocks yet my target was very high. I was not wrong the market collapsed and my target hit with an ease.
This is how we have to analyze the market for entry and exit. We should never place a trade in hurry market will always give opportunity for you to enter trade so time the right trade. It does not mean we have place a trade the moment we see a odd change in the market, we have to wait and confirm that the change is valid reversal point.
Other stocks which we picked also showed some movement.
Check the blog tomorrow at 8.45AM for the stock pick for the day.
Subscribe to our youtube channel (FIG Learn Market the right way)for more updates on understanding the market and follow the facebook page (FIG Financially Independent Group) and the blogger for instant updates.
We have selected some scrips which may give some potential movement on Thursday
(08-03-2018) .
These stocks are capable of showing 3% volatility either above the current price or below.
I will update the scrips with their potential reversal and continuation points. I am not giving any trade tips for now you shall just keep these stocks in your watch list and observe the movement for the day. I will trade only on the below stocks, except if any stocks shows good performance with volume. In either case I will upload my trade video daily in the evening and we will analyze why I performed that trade.
CHART AGENDA
RED LINES ARE RESISTANCE LINES
GREEN LINES ARE SUPPORT LINES
HOW TO TRACK THE STOCKS
I always use 30 mins candle though I do intraday trading, I will explain the candle settings later.
Observe the scrips volatility, at the reference points
Is the sellers increasing or the buyers increasing ?
If you find the strength of sellers or buyers at the reference points using volume, did they succeed in moving the price to their desired value.
Try to find answer for the above questions for detailed analysis later when I post the knowledge content.
BANK INDIA
DHFL
HEXAWARE
JINDALSTEL
MINDTREE
SREINFRA
IDBI
Observe the movement of above stocks as said, and please have a note.
You can also check my you tube channel for more updates on logical Intraday trading in Indian Stock Market here. We will post the updates on how I will book profit with the above stocks today in the evening Subscribe to our youtube channel for more updates
These
are the list of stocks and its support and resistance which I posted
yesterday, these stock gave an average of 4% move today if we had full
capitalized the movement each stock would have give atleast 60% Profit
by using leverage . Click here to see the stocks
I
have place trade on three stocks and gained a profit of 58.5 % intra-day.
I will analyze the two stocks which I traded, you shall analyze other 4
stocks and comment if you have any doubts.
PROFIT
RELINFRA
RelInfra as marked it came to the first support line and found support, here we have to think whether the support came from buyers with good volume, when you had checked the market depth at that time, there were too many buyers at that price level, and the total buyers reduced when the price started to move up, which is probably not the sign of strong buyers.
A strong buyer has to support the price at multiple levels, by bringing in more volume when the price struggles to go up. But in our case it was not. thanks to the Zerodha's Market Depth tool which will help us to identify this.
Once I found that the buyers has lost the strength at the price level near 435 I shorted RELINFRA at 427 after confirming that the support at 427.42 is not longer valid. I booked a huge profit in that. But my friend failed to do so as he had already got locked in the IDBI he just traded with RELINFRA with small margin, but again he made profit :D
IDBI
IDBI as marked it went up to the first resistance line and got rejected, again it tried to move up but again it failed, it shows that the sellers are showing strength. Once the price started to fall it is confirmed that the sellers has come in to control, which clearly bough the price down.
This
is how we have to analyze the market for entry and exit. We should
never place a trade in hurry market will always give opportunity for you
to enter trade so time the right trade. It does not mean we have place a trade the moment we see a odd change in the market, we have to wait and confirm that the change is valid reversal point.
Other stocks which we picked also showed some movement, I booked profit in TV18BRDCST but those stocks did not exhibit strong buy or sell signal. If you check PCJeweller it also showed big movement but I don't have enough capital as all the capital was locked in these three trades.
Check the blog tomorrow at 9AM for the stock pick for the day.
Subscribe to our youtube channel (FIG Learn Market the right way)for more updates on understanding the market and follow the facebook and the blog.
We have selected some scrips which may give some potential movement on Wednes
day (07-03-2018) .
These stocks are capable of showing 1% volatility either above the current price or below.
I will update the scrips with their potential reversal and continuation points. I am not giving any trade tips for now you shall just keep these stocks in your watch list and observe the movement for the day. I will trade only on the below stocks, except if any stocks shows good performance with volume. In either case I will upload my trade video daily in the evening and we will analyze why I performed that trade.
CHART AGENDA
RED LINES ARE RESISTANCE LINES
GREEN LINES ARE SUPPORT LINES
HOW TO TRACK THE STOCKS
I always use 30 mins candle though I do intraday trading, I will explain the candle settings later.
Observe the scrips volatility, at the reference points
Is the sellers increasing or the buyers increasing ?
If you find the strength of sellers or buyers at the reference points using volume, did they succeed in moving the price to their desired value.
Try to find answer for the above questions for detailed analysis later when I post the knowledge content.
BPCL
PCJEWELLER
PVR
RELINFRA
TV18BRDCST
IDBI
Observe the movement of above stocks as said, and please have a note.
You can also check my you tube channel for more updates on logical Intraday trading in Indian Stock Market here. We will post the updates on how I will book profit with the above stocks today in the evening Subscribe to ouryoutube channel for more updates